
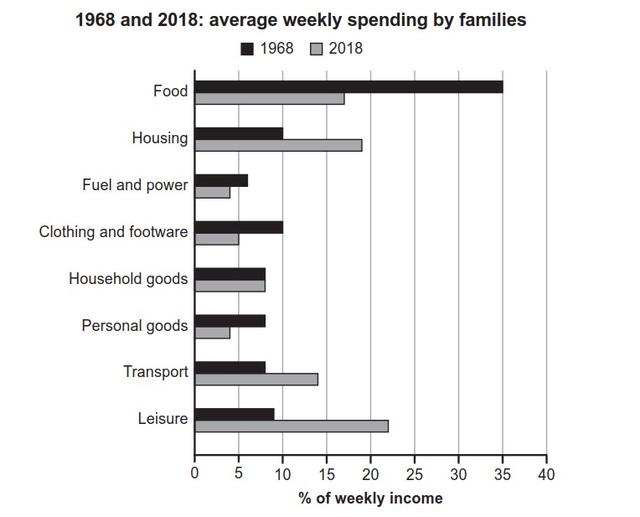
The bar chart compares the information about weekly expenses which families spent in 1968 and in 2018.
Overall
, Linking Words
according to
the given data food consumption was the preferable choice that families spent the most in 1968 Linking Words
whereas
fuel and power were the least. Linking Words
However
, moving forward to 2018, leisure was ranked at the top Linking Words
while
oil and power segments were still not favoured as same as personal Linking Words
goods
.
The most noteworthy spending rate was in the food sector with 35%. Housing and clothing came next with the same amount of 10%. Use synonyms
Then
, it was followed by leisure, which was slightly under 10%. The other three sources, which were transport, household, and personal Linking Words
goods
had the same ratio of around 8%. Fuel and power were the smallest in 1968, which was well above 5%.
Shifting to 2018, leisure increased sharply to approximately 22%. Housing and transport Use synonyms
also
displayed an upward trend with nearly 20% and 15% respectively. Surprisingly, the quantity of food consumption fell dramatically to just above 17%. Linking Words
Additionally
, three remainders, which were fuel, clothing, and personal Linking Words
goods
dropped down to below 5%. Use synonyms
Lastly
, there was no change in Linking Words
goods
for households.Use synonyms