The line graph and pie chart below show information on crime in the UK for the last year. Summarise the information by selecting and reporting the main features, and make comparisons where relevant.

The line graph and pie chart below show information on crime in the UK for the last year. Summarise the information by selecting and reporting the main features, and make comparisons where relevant.
IELTS Writing Task Chart for The line graph and pie chart below show information on crime in the UK for the last year. Summarise the information by selecting and reporting the main features, and make comparisons where relevant.
✨ Do you want to improve your IELTS writing?
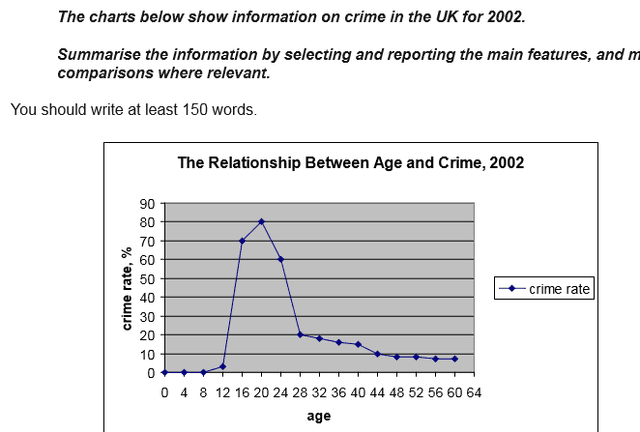
The presented line graph illustrates the number of crimes committed by people of different ages and the pie chart displays the types of crime
last
Linking Words
year, in the UK.
Overall
Linking Words
, young children and senior citizens engaged in the least criminal activities
whereas
Linking Words
the crime rate was the highest among teenagers and adults.
Moreover
Linking Words
, out of all the felonies, almost half of them were of violent nature and the least of them were of public order. The graph depicts that children up to the age of 8 did not engage in any criminal activities
while
Linking Words
the number increased to almost 5000 in the case of 12-year-olds. The 20-year-olds conducted 80,000 felonies; meanwhile, the number decreased drastically among people in the late 20s, dropping to 20,000 among the 28-year-olds. The rate in folks from the 50s-60s was less than 10,000.
According to
Linking Words
the pie chart, almost half of the offences were violent. Property and drug crimes shared a similar percentage of around 20%
while
Linking Words
only 9% of crimes were of public order.

Unauthorized use and/or duplication of this material without express and written permission from this site's author and/or owner is strictly prohibited. Excerpts and links may be used, provided that full and clear credit is given to Writing9 with appropriate and specific direction to the original content.

Sentences: Add more complex sentences.
Linking words: Don't use the same linking words: "while".
Vocabulary: The word "chart" was used 2 times.
Vocabulary: The word "graph" was used 2 times.
Vocabulary: The word "almost" was used 3 times.
What to do next:
Look at other essays: