
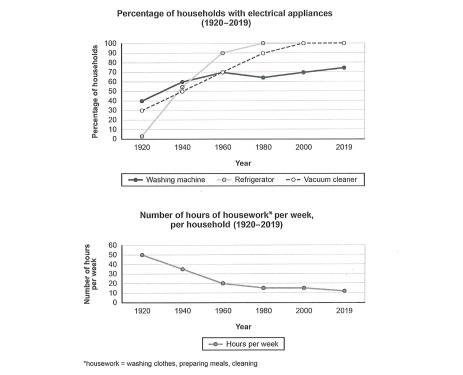
The charts illustrate the details of alterations in ownership of electrical gadgets and time spent doing housework between families in a single nation from 1920 to 2019.
It's clear that in
this
period the proportion of refrigerators increased without stopping, Linking Words
while
the amount of time spent on housework decreased bit by bit.
Linking Words
To begin
with , from 1920 to 2019 the percentage of refrigerators raised rapidly, in 1940 was 58%, Linking Words
whereas
in 1960 was 90% and in 1980 was 100%. Linking Words
Furthermore
, the percentage of households with vacuum cleaners expanded from 1920 to 2019 with an increase of 20% every 20 years from 30%. Linking Words
However
, in Linking Words
this
period the percentage of domestics with washing machines enlarged from 40% in 1920 to 75% in 2019 , Linking Words
while
between 1960 and 1980 was declined from 70% to 63%.
Linking Words
In addition
to Linking Words
this
, the amount of time spent on housework per week dropped by decreased from 1920 to 2019Linking Words