
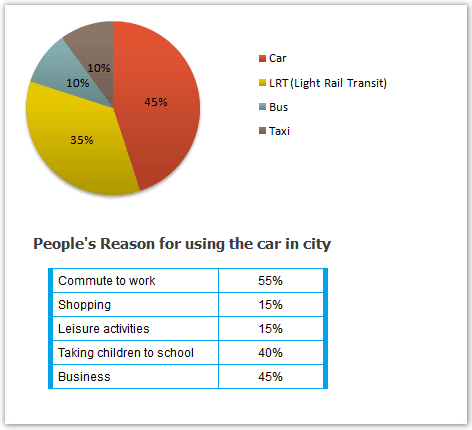
The given two charts illustrate in terms of percentages the transportation and the causes for using a
car
in Edamanten city. Use synonyms
Overall
, what stands out from the graphs is that the Linking Words
the
high figure is seen in Remove the redundancy
apply
Car
with Commute to Work.Use synonyms
Whereas
the reminded categories were relatively the same. The two domineering categories noted the Linking Words
car
and the Light Rail Transit with 45% and 35 prospective .Use synonyms
while
The other transport method Taxi and Bus were identical with only 10%. Linking Words
Furthermore
, In the Linking Words
,
city individuals tend Remove the comma
apply
5the
most to use a Correct your spelling
5 the
car
for work (55% ) .Use synonyms
Moreover
,the proportion of Businesses recorded at 45%. The pickup of children to the school sector was only 5 per cent less than the previous category . Linking Words
Finally
. The least two common domains were Shopping and entertaining activities were equally on 15%.Linking Words