
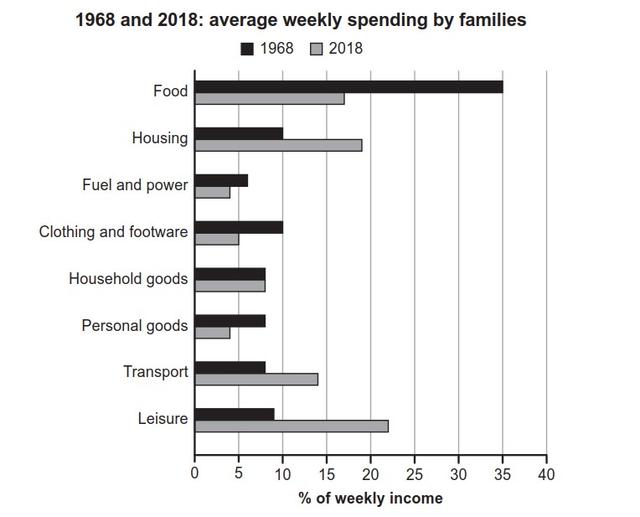
The diagram shows the
proportion
of a family’s weekly income spent on several certain sectors within a country in 1968 and 2018.
There is a noticeable reduction and an increase in family-related spending, from some necessary sectors, which are the cost of food, housing fee and power, and some unnecessaries spending, which are the money spent on goods, communication and things for having fun.
Use synonyms
First,
there can be seen huge reductions in the food sector and personal goods sector between 1968 and 2018, the expense in 1968 is twice higher Linking Words
than
the Change preposition
as
proportion
in 2018. Use synonyms
However
, in 2018, the cost of families’ leisure spending increased significantly, which occupies one-fifth of the families’ expenses.
Linking Words
Secondly
, the Linking Words
proportion
of household goods does not change, it still takes the same Use synonyms
proportion
in the annual family expense, which is nearly ten presents. The transportation and housing spendings are all increase in 2018.Use synonyms