The graph below gives information about the number of cases of diarrhea in Mashhad between 1983 and 1992. Summarise the information by selecting and reporting the main features, and make comparisons where relevant.

The graph below gives information about the number of cases of diarrhea in Mashhad between 1983 and 1992. 

Summarise the information by selecting and reporting the main features, and make comparisons where relevant.
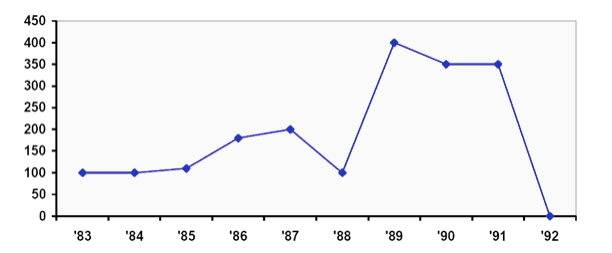
The given graph illustrates the
number
of people who suffered from diarrhoea in Mashhad from 1983 to 1992.
Overall
, it is evident that the
number
of reported cases fluctuated throughout the years
while
the illness peaked in 1989 insulting 400 citizens. In more detail, in the first three years, the
number
of cases levelled off to 100 individuals. Afterwards, a moderate increase is illustrated when the figure doubled in 1997, which is followed by a sudden drop back to a little less than 100 cases.
On the contrary
, from 1988 to 1989 the illness experiences a rapid rise infecting almost 400 people. In the next two years, the
number
of individuals affected by
this
medical condition decreases by a narrow margin of about 50 persons until it plummeted to zero patients in 1992.
Submitted by mariamelina2002 on

Unauthorized use and/or duplication of this material without express and written permission from this site’s author and/or owner is strictly prohibited. Excerpts and links may be used, provided that full and clear credit is given to Writing9 with appropriate and specific direction to the original content.

Sentences: Add more complex sentences.
Common mistake: Your writing should be 150-250 words.
Vocabulary: Replace the words number with synonyms.
Vocabulary: The word "illustrates" was used 2 times.
Vocabulary: The word "number of" was used 4 times.
What to do next:
Look at other essays: