
The
bart
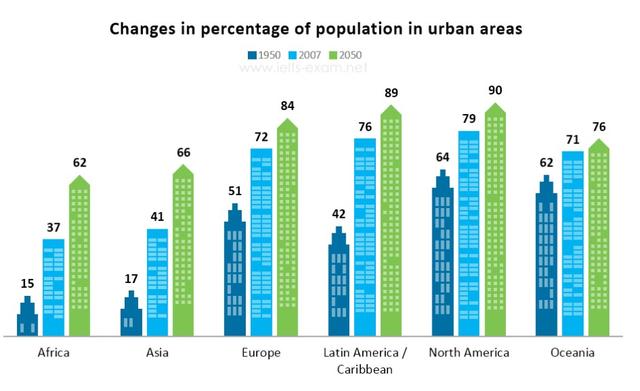
chart above illustrates Correct your spelling
bar
percentage
of Add an article
the percentage
population
living in urban areas in different Add an article
the population
conntinents
, in 1950, 2007 and its projection in 2050.
Correct your spelling
continents
According to
the data, in 1950, more than half of Linking Words
population
in Europe (51%), North Correct article usage
the population
America
(64%), and Use synonyms
Ocenia
(62%) already lived in town, Correct your spelling
Oceania
whereas
in Africa and Asia, only 15% and 17% of its Linking Words
residence
lived in the city. On the other Replace the word
residents
and
, 42% of Latin Correct your spelling
hand
America
/Use synonyms
Carribean
inhibited urban regions for the same year.
Correct your spelling
Caribbean
This
figure continued to rise in 2007, more than doubled for Africa and Asia, and almost half in Europe and Latin Linking Words
America
/Use synonyms
Carribean
compared to the previous Correct your spelling
Caribbean
periode
. Meanwhile, in North Correct your spelling
period
America
and Oceania, the growth Use synonyms
only
15% and 9%, respectively.
The percentage Add a missing verb
was only
projected
to grow in 2050 in all continents, with Add a missing verb
is projected
highest
proportion in Latin Change the article
the highest
America
/Use synonyms
Carribean
and North Correct your spelling
Caribbean
America
, an accounted for 89% and 90% each, with growth Use synonyms
13
% and 11%. In Change preposition
of 13
this
Linking Words
periode
, the highest increase Correct your spelling
period
come
from Africa and Asia with Change the verb form
comes
growth
of 25% and 15% respectively.Add an article
the growth