
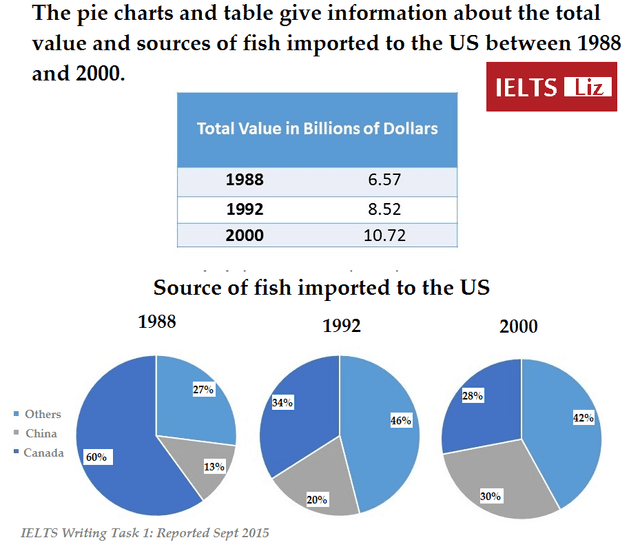
The given table displays the accumulation
value
of Use synonyms
fish
trading and the pie chart depicts the percentage of Use synonyms
fish
obtained from three different countries namely China, Canada, and Use synonyms
others
in the United States of America in a certain period of time (1988 and 2000).
In general, in the year 2000, the total Use synonyms
value
of Use synonyms
fish
trading get highest compared to the Use synonyms
value
in 1992 and 1988. Use synonyms
In addition
, Canada and Linking Words
others
are the two countries which donate more Use synonyms
fish
to the USA, Use synonyms
while
China was contribute the least.
Looking into detail, it is evident that in 2000, there was a huge total Linking Words
value
of the fishing trade, accounting for 10.72. Use synonyms
In contrast
, in the year ,1992 US only received 8.52 billion dollars and the US just gained less profit in 1988 with 6.57 billion dollars.
Linking Words
Furthermore
, the rate of Linking Words
fish
imported from Canada contributed 60 % in 1988, Use synonyms
whereas
in 2000 only 28 % which is the least rate among the three countries. Linking Words
Moreover
, in 1992 and 2000 the proportion of Linking Words
others
donating Use synonyms
fish
to America was the biggest, stated at 46 % and 42 % correspondingly,Meanwhile the least percentage was China only giving 20 % and 30 % respectively. Use synonyms
However
, in 1988 the proportion of Linking Words
fish
imported from Use synonyms
others
only donate 27 % of the total.Use synonyms