
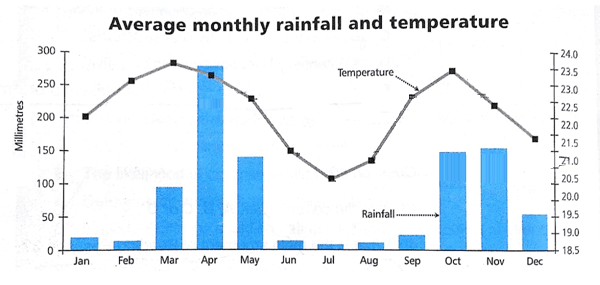
The bar chart gives information about the average monthly precipitation,
while
the line graph illustrates the Linking Words
temperature
in an area of East Africa.
Use synonyms
Overall
, the Linking Words
temperature
in March is the highest point during the year, the opposite is true for July. Use synonyms
In addition
, the average rainfall in April accounts for the largest amount over the year.
As can be seen from the chart, the average precipitation in the two first months is relatively low, just around 25mm, which is followed by a significant increase to reach a peak at approximately 280mm in April. The weather tends to be drier in the following months as the average rainfall reaches the bottom at about 10 Linking Words
mm
in July. There is a slight increase before experiencing a rise to exactly 150 Use synonyms
mm
in October and November. Use synonyms
Finally
, the number of rainfall decreased to 50 Linking Words
mm
in the Use synonyms
last
month.
In terms of Linking Words
temperature
, there is a significant increase from 22 Use synonyms
degrees
in January to a peak at roughly 28 Use synonyms
degrees
in March, followed by a dramatic decline to reach the lowest point of 18 Use synonyms
degrees
in July. Three months later, Use synonyms
temperature
witnesses a considerable rise to above 25 Use synonyms
degrees
before decreasing to about 21 Use synonyms
degrees
in the final month.Use synonyms