
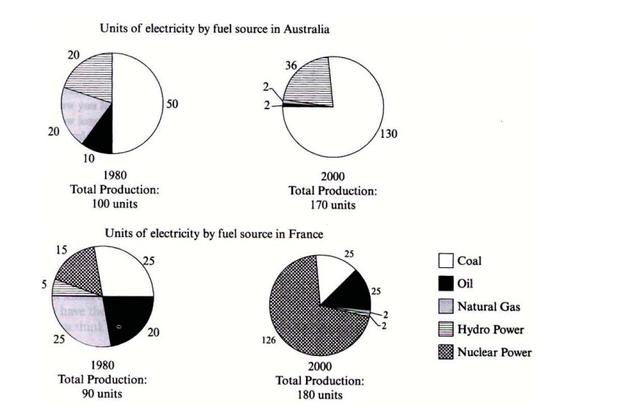
The pie charts illustrate how many
electricity
units are produced using fuel in Use synonyms
Australia
and Use synonyms
France
in 1980 and 2000 Use synonyms
also
.
Linking Words
Overall
, Linking Words
it is clear that
the Linking Words
electricity
units in Use synonyms
France
doubled in 2000 Use synonyms
according to
1980 Linking Words
while
it raised in Linking Words
Australia
by 70%. The main source of Use synonyms
electricity
in Use synonyms
Australia
in both studied years was coal whilst it was nuclear power in Use synonyms
France
.
In more detail, in 1980 the basic resource to produce Use synonyms
electricity
in Use synonyms
Australia
was coal which presented the half of others. The next one was Use synonyms
hydropower
and natural Use synonyms
gas
with an equal proportion of fifth. Use synonyms
Last
but not least was Linking Words
oil
with 10%. Use synonyms
Furthermore
, the situation was different after twenty years as the whole creation increased from 100 to 170. The base resource was still coal with 130 rations and Linking Words
hydropower
came next with 36, and Use synonyms
finally
Linking Words
oil
and Use synonyms
gas
with the same ratio which was 2.
In Use synonyms
France
in the first year, it took 25 coal and 25 Use synonyms
gas
with 20 Use synonyms
oil
and 15 nuclear Use synonyms
while
the Linking Words
hydropower
was 5 to produce 90 electric units. The state differed in 2000 as the creation was multiplied to 180 ones using 126 nuclear power and 25 of both Use synonyms
oil
and coal with 2 of both Use synonyms
hydropower
and Use synonyms
gas
.Use synonyms