
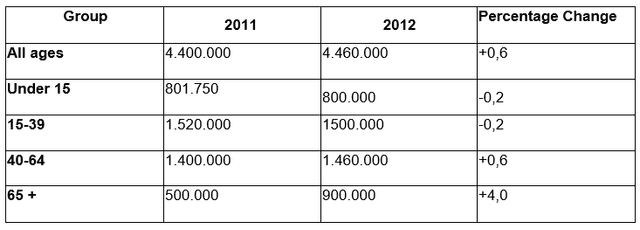
The table provides a breakdown by selected age group of that on population in 5 different age categories: 1) All ages; 2) Under 15; 3) 15-39; 4) 40-64; 5) 65+; of New Zealand between 2011 and 2012.
The table data clearly shows that the highest percentage change was in
category
5) 65+; with +4 per cent, in 2011 in Use synonyms
this
Linking Words
category
we bore 500.000 Use synonyms
people
, 1 year later we bore 900.000 Use synonyms
people
, Use synonyms
while
in comparison with the least indicator in categories 2) Under 15; and 3) 15-39; with -0,2 per cent. In 2011 in Linking Words
category
2) Under 15; we had 801.750 Use synonyms
people
, 1 year later we had 800.000, and in Use synonyms
category
3) 15-39; we had in 2011 1.520.000 folk, and 1 year later we had 1.500.000 folk.
As can be seen from the table, percentage change indicators were in 1) All ages; and 4) 40-64: categories with + 0,6 per cent, what I mean here is that in 2011 in Use synonyms
category
1) All ages; we had 4.400.000 Use synonyms
people
, Use synonyms
while
in 2012 in the same Linking Words
category
we had 4.460.000 Use synonyms
people
and in Use synonyms
category
4) 40-64; in 2011 we honored 1.400.000 Use synonyms
people
, Use synonyms
then
we honored 1.460.000 Linking Words
people
.Use synonyms