
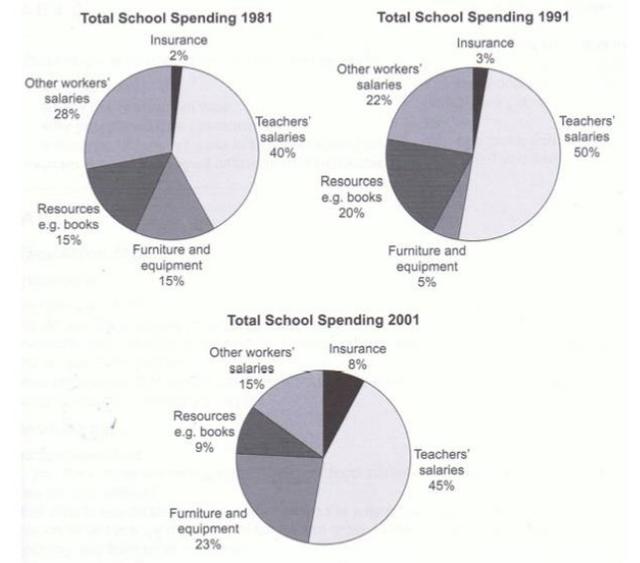
Three pie charts demonstrate the percentages of money spent by a school in the UK, in the years 1981, 1991, and 2001.
Overall
it can be seen that the highest percentage of all expenditures in all three years was allocated for teachers' salaries, Linking Words
while
the least was for the purpose of insurance.
Linking Words
To begin
with, during Linking Words
this
period, approximately half of the spending was on payments to teachers at 40% in 1981, 50% in 1991, and 45% in 2001. Linking Words
Furthermore
, around one-fourth of the money was distributed for other workers' salaries in 1981 and 1991, Linking Words
although
it dropped to 15% in the Linking Words
last
year.
In 1981, a similar percentage of finance was given for resources and types of furniture and equipment at 15%. Linking Words
However
, the figure for books increased by 5% in 1991 and again dropped by around half in 2001, Linking Words
while
the number for equipment, decreased drastically by 10% in 1991, and again rose up to 23% in 2001. Linking Words
Finally
, the money for insurance was never increased by more than 10% throughout the period.Linking Words