
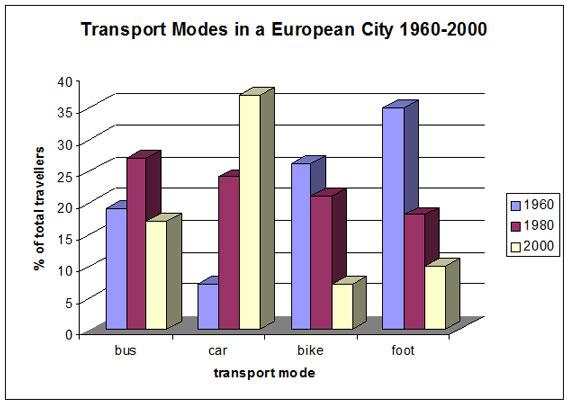
The bar chart given presents data about the proportion of the number of travellers based on four types of transport accommodation in a European City which is divided into 1960, 1980, and 2000.
In general, machine vehicles were the most used in 2000,
while
eco-friendly modes were in 1960.
Regarding machine transport accommodations, the bus was the most frequent in 1960, with around 20%, and Linking Words
then
the trend changed in 2000 with the car in the top spot with double proportion by over 40%. The car vehicles jumped over the given time period, with the starting point was in 5% in 1960, Linking Words
then
climbed rapidly by more than a third in 2000 to 40%.
Turning to eco-friendly modes, there was a downward trend over the time period. The foot was the most used at the beginning (with a difference of around 10% compared with the bike) and the Linking Words
last
(the difference with the bike was around 3%) of the given time period compared with others. Meanwhile, the bike was in the top spot in 1980 as a fifth compared with other modes before it plummed from around 15% to over 5% in 2000.Linking Words