
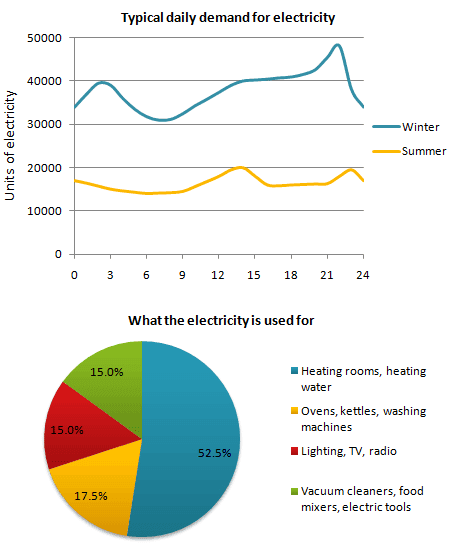
The first
chart
illustrates the demand for Use synonyms
electricity
in the United Kingdom during ordinary days in winter and summer. The second bar Use synonyms
chart
gives information about how Use synonyms
electricity
is used in an average British family.
Use synonyms
Overall
, it can be clearly seen in the first Linking Words
chart
that the typical daily consumption of Use synonyms
electricity
is more than 40000 units per single day. Use synonyms
Otherwise
, on summer days, there is the lowest rate of consuming energy is less than 20000 per 9 hours among British individuals.
Linking Words
According to
the first graph, the daily demand for energy is higher in winter (nearly 40000 units per 3 hours) Linking Words
whereas
, in summer days it is considerably lower (among 10000 per 3 hours).
Referring to the given data in the second pie Linking Words
chart
, the main purpose of using Use synonyms
electricity
is to heat rooms and heating water of English households. Use synonyms
After
Linking Words
this
, English homes use Linking Words
electricity
for ovens, kettles and washing machines. It is interesting to note that Use synonyms
electricity
used for lighting, TV, and radio is equal for vacuum cleaners, food mixers and electric tools.Use synonyms