
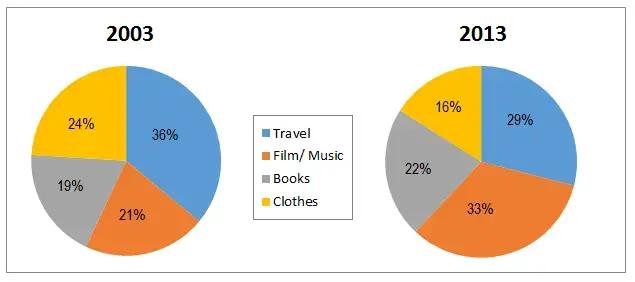
A breakdown of the Internet shopping sales for each section in New Zealand during the years 2003 and 2013 is enumerated in the presented pie charts.
Looking from an
overall
perspective, Linking Words
it is clear that
the travel and entertainment categories were the most popular when juxtaposed with the others.
As can be seen in the first diagram, the excursion sector was Linking Words
initially
at 36%, Linking Words
however
, after a 10-year period, Linking Words
this
percentage depleted to 29%. In fact, the former class Linking Words
along with
clothing items were the only ones which had experienced a drop in proportion. Linking Words
Moreover
, in 2013, online sales for film and music were at a whopping 33%. Linking Words
On the other hand
, in 2003, it had been at a measly 21 per cent. Linking Words
This
highlights that major growth took place as time passed.
Turning to the details, the figure for clothes was 24% at first. Linking Words
Nevertheless
, it witnessed an eight per cent decline throughout the years. Linking Words
Also
, from 19% to 22%, it could be mentioned that books had the opposite trendLinking Words