
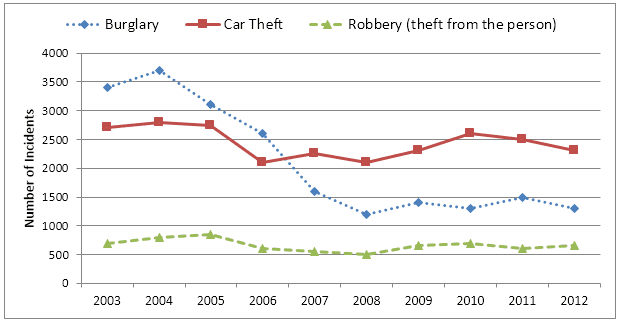
The given graph illustrates information on how the number of incidents has changed in three types of crime,
such
as burglary, car theft, and robbery in Newport city centre over a decade.
Linking Words
Overall
, the differences in rates of burglaries are much stronger than in other areas.
Suppose that the number of car thefts and robberies are similar at the beginning of the timeline and in the ending, Linking Words
while
there was a dramatic decrease in burglary rates, which were a little bit less than 3500 cases in 2003 and dropped by 2000 till 2012. Linking Words
On the other hand
, the quantity of car thefts has seen a steady movement first two years. After it reached a low point in 2006. There was a fluctuation in Linking Words
this
crime type next four years and Linking Words
then
it became a growing and came back to its starting value. What about the robberies, there was a slight rise from 2003 to 2005. Linking Words
Nevertheless
, the percentage of robberies experienced a gradual decline till 2008 and in that year it bottomed out. Linking Words
However
, it increased and constituted about 500 incidents in 2012.Linking Words