
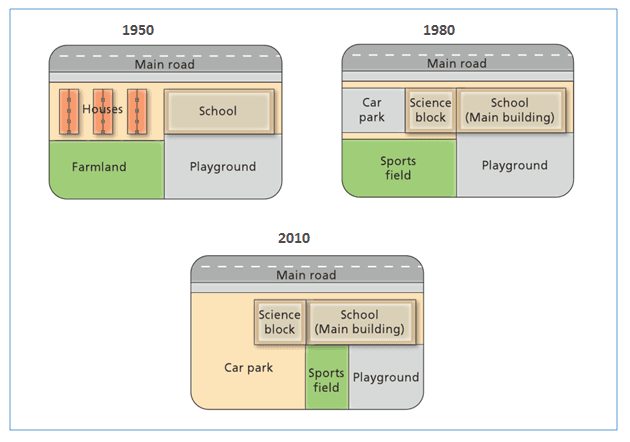
The given schematic represents the transitional changes that have taken place at West Park Secondary School since its foundational start in 1950.
Primarily, throughout all the represented years, the main road held its place intact, talking about the school and playground
first,
Linking Words
then
in 1980, the education building saw an expansion Linking Words
while
the play area occupied the same area and as we shift to 2010 Linking Words
then
the recreational area saw a decline in its occupancy space Linking Words
while
the other stayed same.
Now moving on to the other zones, Linking Words
then
in 1950, houses and farmland occupied half of the space opposite the transportation street and Linking Words
this
whole was replaced by the car park, science block and sports field after 30 years. Linking Words
Finally
, in 2010, the parking space saw the highest increase Linking Words
while
the science block and training field saw the decrease.Linking Words