
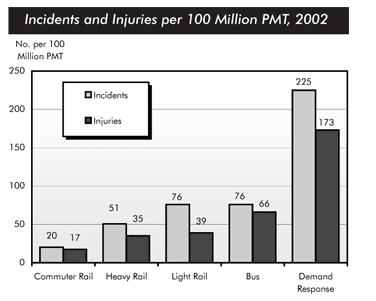
The given chart represents the number of injuries and incidents that occurred per 100 million PMT across various transportation modes in the year 2002.
Firstly
, starting with the highest Linking Words
then
the demand response stood at 225 in incidents and for the injuries it was 173. Linking Words
In contrast
, the lowest was held by the commuter rail with the number standing at 20 for the events and 17 for the affected.
Talking about light rail and buses Linking Words
then
76 was the reported data for the event Linking Words
while
39 and 66 for injured. Linking Words
Lastly
, for heavy rail, the former stood at 51 Linking Words
while
the latter at 35. Linking Words
Overall
, in both cases, the trend followed a rise as we move from left to right.Linking Words