
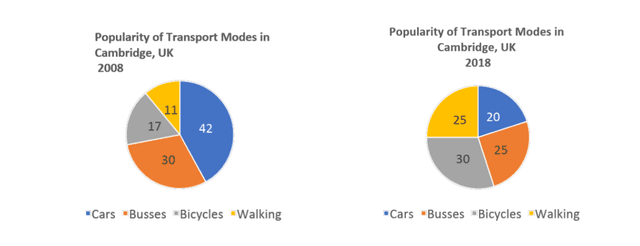
The pie charts compare the popularity of four modes of transportation: cars, busses, bicycles, and walking in Cambridge UK in 2008 and 2018.
Overall
, in ten years, there was a significant drop in automobile usage, contrary to the popularity of cycling and walking, which had gradually risen by 2018.
Linking Words
To begin
with, cars were the most popular means of transport in 2008 with 42% of the population choosing to use them. Linking Words
Next,
buses were in the second position with 30% of people in Cambridge loving the public transportation. Linking Words
Furthermore
, bicycles and walking were the least favourites, with only 17% and 11% respectively.
Linking Words
On the other hand
, the automotive had decreased to more than half in just ten years. Linking Words
Although
cars still had around 20% of usage, they had been replaced by bikes as the most favoured in the city with a 13% increase to 30%. Linking Words
Moreover
, walking had raised to a quarter, the same level busses had plunged into.Linking Words