
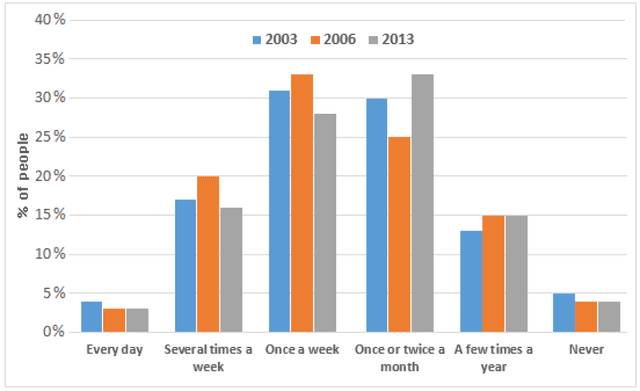
The bar chart provided depicts the frequency of eating in fast food restaurants among Americans, considering six distinct categories from 2003 to 2013.
Overall
, as can be vividly seen from the graph, every day and never usage classes experienced a sight decline during the interval given, Linking Words
whereas
the pattern for eating a few Linking Words
times
a year was upward. Use synonyms
Furthermore
, the figures for two categories, namely Several Linking Words
times
a week and Once a week, decreased with a fluctuation, Use synonyms
while
the pattern for Once or twice a month was exactly the opposite.
As illustrated by the chart, commencing at 5% and just under 5%, the number of people who ate fast food never and every day dropped somewhat to around 4% and 2.5% in 2013, respectively. Linking Words
However
, the figures for people who went to a fast food restaurant a few Linking Words
times
each year rose considerably from approximately 12.5% in 2003 to 15% in 2013.
Use synonyms
By contrast
, the figures for Once and several Linking Words
times
a week witnessed an increase from nearly 30% and around 16% to almost 33% and 20% before falling sharply to approximately 27% and 15.5%, respectively. Once or twice each month category, Use synonyms
however
, underwent a drastic rise from 25% to almost 33% in 2013 after declining tremendously by 5% in 2006.Linking Words