
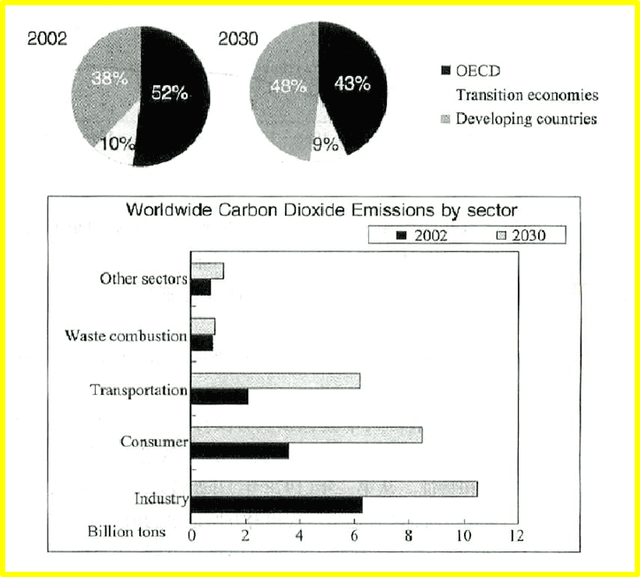
The graphs give past and future data concerning worldwide
carbon
Use synonyms
dioxide
Use synonyms
emissions
.
As can be seen in the two pie charts, developing Use synonyms
countries
are expected to account for a bigger share of Use synonyms
emissions
in 2030, 48%, compared to 38% in 2002. Use synonyms
In contrast
, OECD Linking Words
countries
are projected to make up a lower proportion, 43%, 9% down over the same period. Use synonyms
Countries
with transition economies are estimated to take up the remaining 9% in 2030, 1 % less than in 2002.
The bar chart reveals that Use synonyms
carbon
Use synonyms
dioxide
Use synonyms
emissions
will expand to varying degrees in different sectors by 2030. The industry will continue to be the major producer of Use synonyms
carbon
Use synonyms
dioxide
, rising to more than 10 Use synonyms
billion
tons in 2030. Next comes the consumer sector, which is projected to more than double its Use synonyms
emissions
from less than 4 Use synonyms
billion
to 8 Use synonyms
billion
or more tons. Transportation, the third largest producer, will see a huge growth to 6 Use synonyms
billion
, triple the amount in 2002. Use synonyms
By comparison
, waste combustion and other sectors make up a much lower proportion, each producing an estimated 1 Linking Words
billion
Use synonyms
carbon
Use synonyms
dioxide
.
To summarise, developing Use synonyms
countries
will overtake OECD Use synonyms
countries
to become the major Use synonyms
carbon
Use synonyms
dioxide
emission producer by 2030. Use synonyms
While
industry is responsible for the highest amount of Linking Words
carbon
Use synonyms
dioxide
Use synonyms
emissions
, consumer and transportation experience the greatest increases.Use synonyms