The bar chart shows how many tourists visit four different museums in London over a five month period from June to October.

The bar chart shows how many tourists visit four different museums in London over a five month period from June to October.
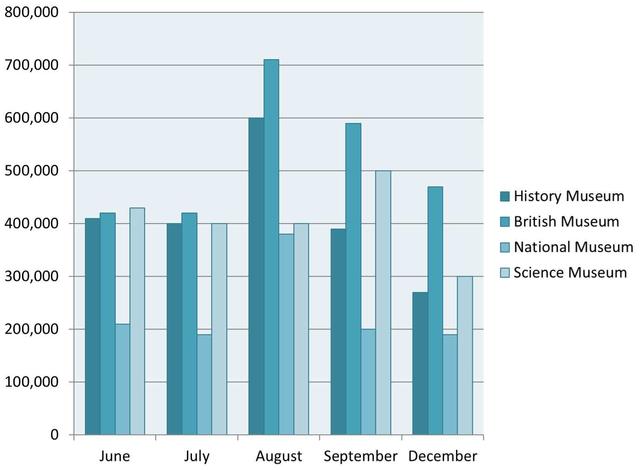
The bar chart above shows the information of some studies between
students
of 5th classes over the period of 20 years.
This
means that every student has enough opportunity to have an appropriate education during that period. Indeed, some of the
students
,
for instance
, A classes always have suitable forms to wear,
while
the others never had been rich and they could not buy something like
this
. every year when they go to school,
students
know how to do with it. In
this
case, the government should include these mistakes and develop some programs to help poor
students
. In conclusion, it is the best idea to help people every time whenever you can.
Submitted by khoshimovkomronbek on

Unauthorized use and/or duplication of this material without express and written permission from this site’s author and/or owner is strictly prohibited. Excerpts and links may be used, provided that full and clear credit is given to Writing9 with appropriate and specific direction to the original content.

Sentences: Add more complex sentences.
Common mistake: Your writing should be 150-250 words.
Basic structure: Change the second paragraph.
Basic structure: Change the third paragraph.
Vocabulary: Replace the words students with synonyms.
Vocabulary: Rephrase the word "shows" in your introduction.
Vocabulary: Only 3 basic words for charts were used.
Vocabulary: Use several vocabularies to present the data in the second paragraph.
Vocabulary: Use several vocabularies to present the data in the third paragraph.
What to do next:
Look at other essays: