
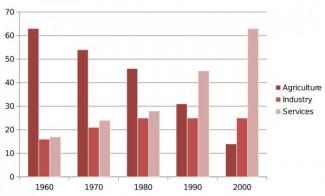
The bar chart provides information about the contribution made by sectors to Indian gross domestic products between 1960 and 2000.
Overall
, it can be seen that the three major sectors are agriculture, industry and services. Linking Words
Moreover
, the services had an increased variation, Linking Words
as well as
, agriculture plummet change.
Linking Words
To begin
with, agriculture made 60% of the contribution to Linking Words
GDP
in 1960. Use synonyms
Furthermore
, production has dramatically fallen in the upcoming years, Linking Words
as well as
, it contributed 15% to Linking Words
GDP
in 2000. Use synonyms
On the other hand
, the industry sector remained constant in productivity.
Linking Words
In addition
, it contributed 15% of materials to Linking Words
GDP
Use synonyms
,
but managed to produce 30% in 1990. Remove the comma
apply
Although
, Linking Words
at the end
of the period Linking Words
this
manufactured only 25% of products.
Linking Words
Secondly
, the Linking Words
last
sector services it manufactured 15% of goods to Linking Words
GDP
. Use synonyms
However
, it had a rise variation, the production of goods reached a peak in 2000. Linking Words
At the end
of , the era it contributed 65% of materials to Gross Domestic Product.Linking Words