
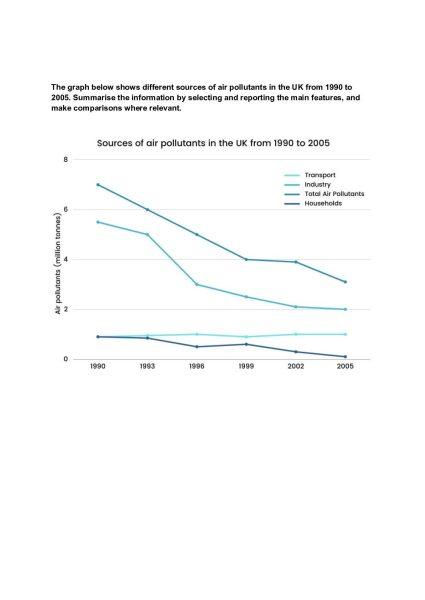
The chart illustrates the number of
air
pollutants from three resources between 1990 and 2005 in the UK.The units are measured in millions of tons.
The total Use synonyms
air
pollution started at around 7 Use synonyms
million
and Use synonyms
then
dramatically fell to 4 Linking Words
million
in 1999 and Use synonyms
then
remained nonchanged until 2002. Afterwards, declining roughly 1 Linking Words
million
reaching approximately 3 Use synonyms
million
in 2005.
Use synonyms
overall
, there was a decreasing rate of Linking Words
air
pollution over the period. In terms of Industry, it experienced the highest proportion of pollution compared with other resources. Use synonyms
Likewise
,Households recorded the lowest rate of the total Linking Words
air
population. The transport system was considered the second factor of a higher Use synonyms
air
population.
Use synonyms
According to
Industry, started at around 6 Linking Words
million
tones and Use synonyms
then
significantly declined to approximately 2 Linking Words
million
tones. Use synonyms
However
, households began with close to 1 Linking Words
million
Use synonyms
then
showed a stable period until 1993 before a slight decrease to nearly 0.5 Linking Words
million
tonnes in 1996. There was a small rose until reached about 1 Use synonyms
million
before declining to near zero in the final year.
Use synonyms
Moreover
,Transport started with about 1 Linking Words
million
in 1993 and Use synonyms
then
experienced a steady increase until reach a peak of more or less than 1.1 Linking Words
million
and Use synonyms
then
fluctuated until reached close to 1.2 or 1.3 Linking Words
million
tones.Use synonyms