
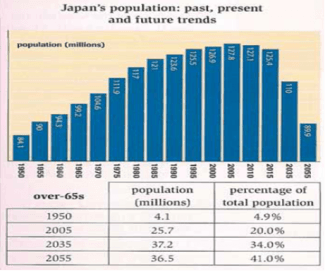
The Bar graph and table illustrate how many people were residing in Japan and provide the elder people proportion between 1950 to 2055.
Overall
, it is noticeable that the population count rate is slowly declining since 2000 and the prediction for the future is less compared to the past trend. Linking Words
In contrast
, the age over 65 shows a good amount of improvement over the year and is predicted to be half of the population in the future.
In regard to the trends, from 1950 to 2000 the people range had a minimum of 5% growth all over the period and it gained the number of 126.9 by 2000. Linking Words
Whereas
in 2005 the count of human beings faced only a slight increase of 1% than 5 years ago. Meanwhile, from 2010 to 2015 the figure started to drop in the difference of 2%, but looking at the prediction it faced a huge fall in the digit by 2055, with 89.9 million.
In terms of senior citizens, in 1950 their accommodation in Japan was 4.1 million with 4.9% of the total population. Year by year, the age over-65's group started to improve their residence in Japan at 15% by 2005. The future prediction of Linking Words
this
group will be growing higher and they will reach 41.0% by 2055 among 89.9 million.Linking Words