The line graph illustrates three different kind of crimes that occurred in Newport city centre between 2003 and 2012.

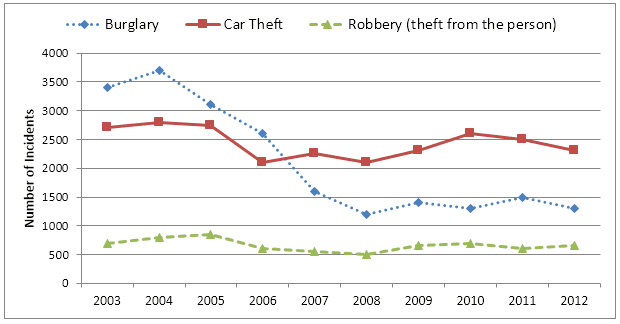
The alterations that took place in three distinct areas of crime in Newport city centre in a 10-year span were presented in the line graph.
Overall
, throughout the given period of time, all aspects of crime witnessed fluctuations, where burglary gave a place for car theft in the specific period, whereas
robbery remained low but steady.
Firstly
, as can be seen in the graph, at the onset of time, burglary and car theft displayed 3400 and a little more than 2500 cases respectively. However
, after 4 years, they had a number as much as each other, so both experienced a reduction to just above 2000 incidents. Next,
burglary continued to fluctuate until the finish line, showing 1400. What about car theft, it faced a margin increase in 2012, presenting just below 2500 cases.
Finally
, it is crystal clear from the graph that robbery was the least evident crime and remained in this
position during the timeline by moderately hesitating. In 2003, there were about 700 incidents of it and after 9 years, the number did not change.Submitted by dnm.best on
Unauthorized use and/or duplication of this material without express and written permission from this site’s author and/or owner is strictly prohibited. Excerpts and links may be used, provided that full and clear credit is given to Writing9 with appropriate and specific direction to the original content.
Introduction: The introduction is missing.
▼
Introduction: The chart intro is missing.
▼
Introduction: The chart intro is missing.
▼
Vocabulary: Rephrase the word "undefined" in your introduction.
▼
Vocabulary: The word "graph" was used 3 times.
▼
Vocabulary: The word "give" was used 2 times.
▼
Vocabulary: The word "remained" was used 2 times.
▼
Vocabulary: The word "fluctuations" was used 2 times.
▼
Vocabulary: The word "about" was used 2 times.
▼