
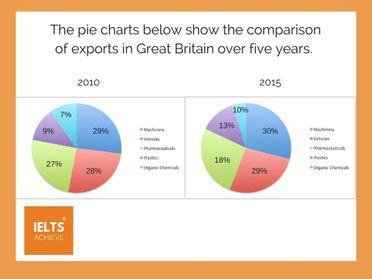
The given pie charts illustrate the information on
comparison
of exported goods of 5 categories in Great Britain over 5 years between 2010 and 2015.
Add an article
the comparison
Overall
, Linking Words
besides
pharmaceuticals, all other exported goods seem to have increased percentages for the given time period and exportation of Great Britain mainly consisted of machinery, vehicles and Linking Words
phramaceuticals
throughout the given time frame.
It can clearly be observed thatCorrect your spelling
pharmaceuticals
,
the vast majority of exported products seem to be machinery and vehicles with approximately one-Remove the comma
apply
third
of all both in 2010 and 2015, Linking Words
Linking Words
moreover
both of these categories saw onlyAdd a comma
,moreover
1
% increase over the given period. Correct article usage
a 1
On the other hand
, organic chemicals occur to have the least rates for both years with 7% and 10% respectively in 2010 and 2015 and their export rates went up by 3% over 5 years.
Interestingly, Pharmaceuticals experienced a decrease of 9% over the given time frame, Linking Words
Linking Words
however
the percentage of exported plastic products went up from 9% in 2010 to 13% in 2015.Add a comma
,however