The chart below shows how frequently people in the USA ate in fast food restaurants between 2003 and 2013. Summarise the information by selecting and reporting the main features, and make comparisons where relevant.

The chart below shows how frequently people in the USA ate in fast food restaurants between 2003 and 2013.

Summarise the information by selecting and reporting the main features, and make comparisons where relevant.
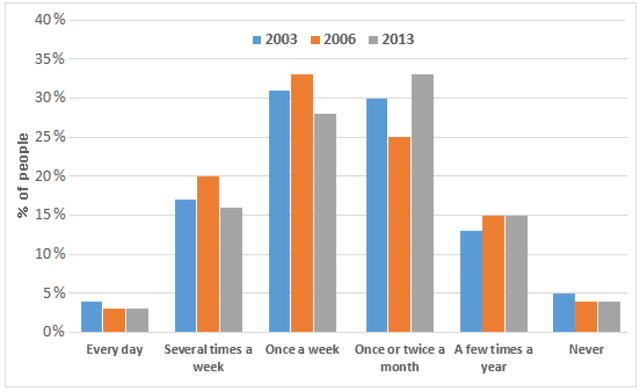
The given bar chart illustrates the frequency of Americans eating out in fast food restaurants between 2003 and 2013.
Overall
, it is clearly seen that the majority of the population consumed fast food once a week and once or twice a month throughout the period,
whereas
few people preferred to eat every day and some never.
According to
the chart, the percentage of people who ate several times a week increased by approximately 4% between 2003 and 2006. Later it experienced a slight decline to around 16%. Those who consumed once a week went up from around 31% to one-third. Later it dropped to slightly above a quarter. The percentage of citizens who had eaten once or twice a month decreased from sharply 30% to exactly a quarter between 2003 and 2006.
However
, in 2013 it showed a dramatic uptrend and reached roughly one-third. Folk who consumed a few times a year could not reach above 15% in a decade period.
Submitted by wind1y998 on

Unauthorized use and/or duplication of this material without express and written permission from this site’s author and/or owner is strictly prohibited. Excerpts and links may be used, provided that full and clear credit is given to Writing9 with appropriate and specific direction to the original content.

Sentences: Add more complex sentences.
Vocabulary: The word "chart" was used 2 times.
Vocabulary: The word "percentage" was used 2 times.
Vocabulary: The word "reached" was used 2 times.
Vocabulary: The word "around" was used 2 times.
Vocabulary: The word "slight" was used 2 times.
Vocabulary: Use several vocabularies to present the data in the second paragraph.
Topic Vocabulary:
  • fast food consumption
  • dining frequency
  • decade overview
  • trend analysis
  • to dine out
  • fluctuation
  • sharp increase
  • gradual decline
  • eating habits
  • statistical comparison
  • consuming pattern
  • noteworthy change
  • anomaly
  • periodic comparison
  • data interpretation
What to do next:
Look at other essays: