
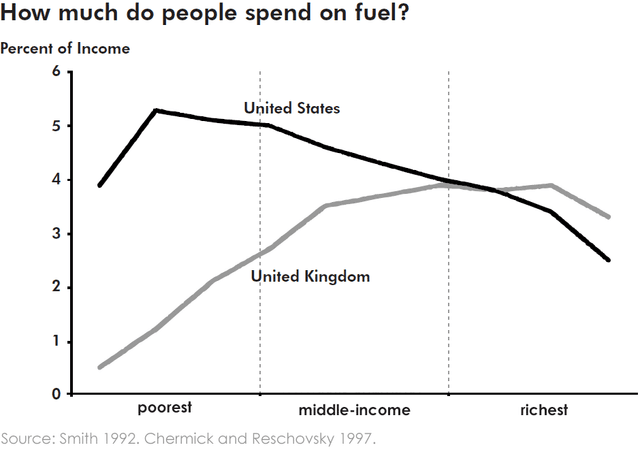
The line graph illustrates the proportions of how three different categories of individuals spend on fuel in the United Kingdom and America.
Overall
it is evident that the poorest spend the least on petrol in the United Kingdom Linking Words
while
in the United States, they spend the highest. In reversal, the richest in the USA spend the least on gas yet more money is used by the wealthy individual in Uk.
As we can see, poor people in the USA use almost 4% of their income on gas Linking Words
in contrast
to the UK where they use about 0.5% of their revenue on petrol. Linking Words
Conversely
, approximately 2.5% of well-to-do Linking Words
citizen’s
income is used to purchase petrol in the United States of America and marginally over 3% of revenue is utilized to buy gas in the United Kingdom.
In terms of middle-income earners, both nations nearly Fix the agreement mistake
citizens’
utilizing
money Wrong verb form
utilise
in
between 3% to 5%Change preposition
apply