The graph below shows the number of university graduates in Canada from 1992 to 2007. Summaries the information by selecting and reporting the main features and making comparisons where relevant. You should write at least 150 words.

The graph below shows the number of university graduates in Canada from 1992 to 2007. Summaries the information by selecting and reporting the main features and making comparisons where relevant. You should write at least 150 words.
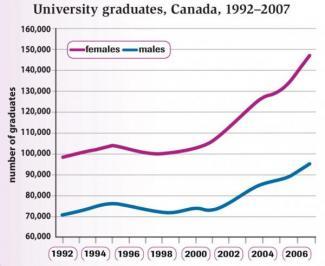
The graph illustrates the proportion of university students who graduated in Canada over the period 1992 to 2007.
overall
, the graph depicts the percentage of females more than
males
that in the early ,years it has slight fluctuations but it growing gradually to 2006 opposite of the rate of
males
which slowly increased.
according to
the ,
graph
Add a comma
,graph
show examples
it is easy to see that the figure for graduate females has the highest growth than
males
until 2006,
,,
Change the punctuation
apply
show examples
However
Add a comma
,However
show examples
it
start
Change the verb form
starts
show examples
to increase slightly from the beginning of the period in 100,000at 1992,
whereas
males
record at the point of 70.000 in the same year. in 2004 experienced the male rate little rise up . in ,contrast woman maintained their per cent to the rocketed puck to record 150.000graduate in 2007.
Submitted by Ssaraan2017 on

Unauthorized use and/or duplication of this material without express and written permission from this site’s author and/or owner is strictly prohibited. Excerpts and links may be used, provided that full and clear credit is given to Writing9 with appropriate and specific direction to the original content.

Sentences: Add more complex sentences.
Common mistake: Your writing should be 150-250 words.
Vocabulary: Replace the words males with synonyms.
Vocabulary: The word "graph" was used 3 times.
Vocabulary: The word "increased" was used 2 times.
Vocabulary: The word "slight" was used 2 times.
What to do next:
Look at other essays: