The chart below gives information about species used for animal testing in the U.S. Summarise the information by selecting and reporting the main features, and make comparisons where relevant.

The chart below gives information about species used for animal testing in the U.S.

Summarise the information by selecting and reporting the main features, and make comparisons where relevant.
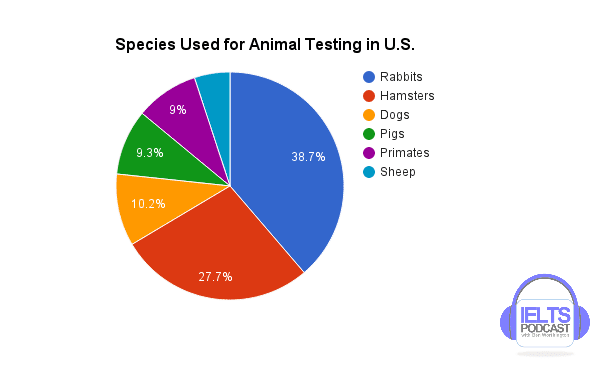
The given pie chart depicts information about the species which are used for animal testing in the US.
Overall
, the maximum proportion of rabbits
are
Change the verb form
is
show examples
used for animal testing , whilst the minimum percentile of primates
are
Change the verb form
is
show examples
used for animal testing. After analysing, it can be seen clearly that the percentage of dogs was approximately a tenth,
whereas
the proportion of hamsters was just above a quarter which is used for animal testing. The negligible difference was seen in the per centum of primates and pigs who were used for animal testing, it was 9% for the former and 9.3% for the latter. The pie chart
further
collates that a difference of nearly a third was observed in the proportion of rabbits and sheep, the respective figures were 38.7% and 5.1%.
Submitted by MANJOT on

Unauthorized use and/or duplication of this material without express and written permission from this site’s author and/or owner is strictly prohibited. Excerpts and links may be used, provided that full and clear credit is given to Writing9 with appropriate and specific direction to the original content.

Common mistake: Your writing should be 150-250 words.
Vocabulary: Rephrase your introduction. Words match: 75%.
Vocabulary: Rephrase the word "information" in your introduction.
Vocabulary: The word "chart" was used 2 times.
Vocabulary: The word "difference" was used 2 times.
Vocabulary: The word "proportion" was used 3 times.
What to do next:
Look at other essays: