
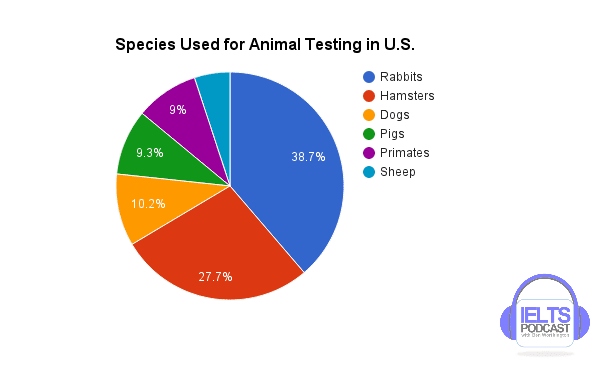
The pie chart illustrates different kinds of
animals
being used in Use synonyms
research
experiments in the U.S. There are 6 lists of Use synonyms
animals
used for testing a product and units are being measured by percentage.
Use synonyms
Overall
, Linking Words
rabbits
are the most common Use synonyms
animals
used for Use synonyms
research
experiments Use synonyms
while
sheep are the Linking Words
last
type of animal used for testing Linking Words
research
.
The biggest percentage of Use synonyms
animals
shown in the chart is Use synonyms
rabbits
. There are 38.7 % of Use synonyms
rabbits
are being used for animal testing in the U.S. After Use synonyms
rabbits
, hamsters Use synonyms
also
being used for Linking Words
research
. As we can see from the chart there is 27.7% of animal testing is using hamsters. Dogs are in the third position where there is 10.2% of Use synonyms
research
tested on dogs.
The three latest Use synonyms
animals
in the diagram for animal testing in the U.S. are pigs (9.3%), primates (9%) and sheep. Use synonyms
Although
there is no exact information on the number of sheep, Linking Words
this
animal is still used for testing a product but not as many as Linking Words
rabbits
and hamsters.Use synonyms