The chart below gives information about species used for animal testing in the U.S. Summarise the information by selecting and reporting the main features, and make comparisons where relevant.

The chart below gives information about species used for animal testing in the U.S.

Summarise the information by selecting and reporting the main features, and make comparisons where relevant.
Overall
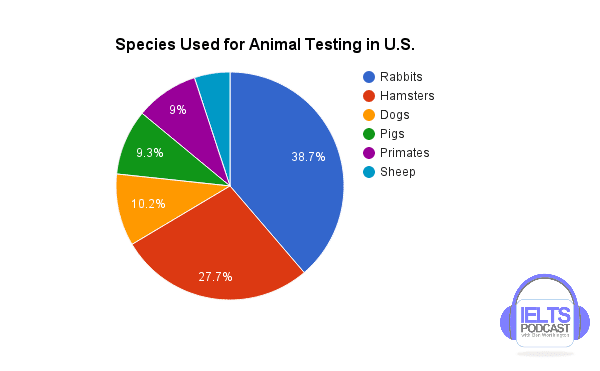
, the pie chart illustrates information about six different species that have been used for animal testing in the United States. The largest segment in animal testing was contributed by rabbits and hamsters, at 38.7% largest in demographic and 27.7% for hamsters slightly lower than rabbits, and comes at second highest in the chart, respectively.
Whereas
, 9.3% of pigs and 9% of primates have been tested for animal testing. In comparison dogs testing was a little high in percentage at 10.2%, which combined these three segments turned out to be near as testing of hamsters appositely. Remained 4 to 6% of animal testing was done on
sheeps
Correct your spelling
sheep
show examples
.
Submitted by user349953 on

Unauthorized use and/or duplication of this material without express and written permission from this site’s author and/or owner is strictly prohibited. Excerpts and links may be used, provided that full and clear credit is given to Writing9 with appropriate and specific direction to the original content.

Common mistake: Your writing should be 150-250 words.
Vocabulary: Rephrase your introduction. Words match: 75%.
Vocabulary: Rephrase the word "information" in your introduction.
Vocabulary: The word "chart" was used 2 times.
What to do next:
Look at other essays: