
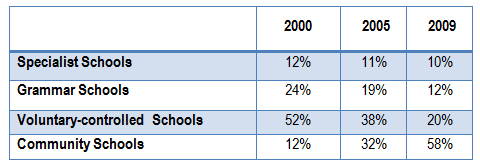
The table provides information about the percentage of kids attending different high
schools
from the year 2000 to 2009.Use synonyms
Overall
, it is understandable that by 2009 , intake for student admissions have been improved in community Linking Words
schools
. Use synonyms
In contrast
, where other Linking Words
school
admissions have decreased and are below 20%.
In regard to the specialist Use synonyms
schools
, in 2000 they had 12% of students in their Use synonyms
school
, Use synonyms
while
by 2005 and 2009 it got reduced by 1% in each year. Moving to Grammer Linking Words
schools
, they Use synonyms
also
faced the highest value only in the year 2000 with 24%, five years later they faced a decline of 5% in growth and by 2009 it went to the rate of 12%.
In terms of voluntary controlled Linking Words
schools
, half of the pupils were enrolled in their Use synonyms
school
by 2000 and in 2009 they faced a drastic change in proportion, Use synonyms
as a result
, it was only 20% of people went to that Linking Words
school
. Looking at the community Use synonyms
schools
, they gained a good amount of students, with 58% and they hold first place in 2009.Use synonyms