
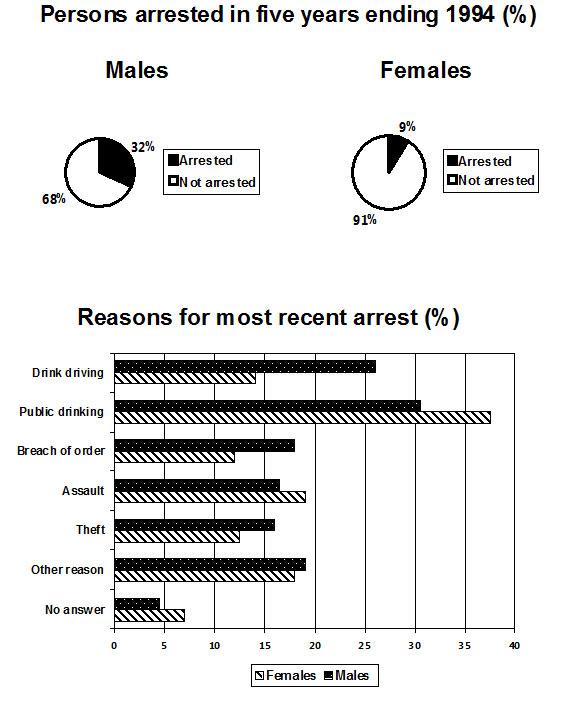
The graphs illustrate two genders who were arrested during the period of five years and provide information on different types of recent arrests made with the given reasons.
Overall
, Male persons have surpassed the female gender for getting apprehended more Linking Words
whereas
, there are some cases where Linking Words
women
were arrested to a greater extent when compared to the male majority.
Throughout the five years, Men were the highest number of arrested people at around 32% Use synonyms
while
, Linking Words
women
were significantly less than 10%. Use synonyms
Moreover
, it suggests that by the end of the year 1994, Females were comparatively larger in numbers for not getting arrested at more than 90%, Linking Words
on the other hand
, Males who did not get arrested were Linking Words
subsequently
lesser than 70%.
Linking Words
However
, there are cases like Public drinking, Assault, and not providing any answer where Linking Words
women
were the highest recorded people for arrests and in one arrest it reached almost 40% and the highest of that time. Use synonyms
Furthermore
, Drunk driving, Breach of order, robberies, and for several other reasons men have crossed Linking Words
women
for apprehension.Use synonyms