
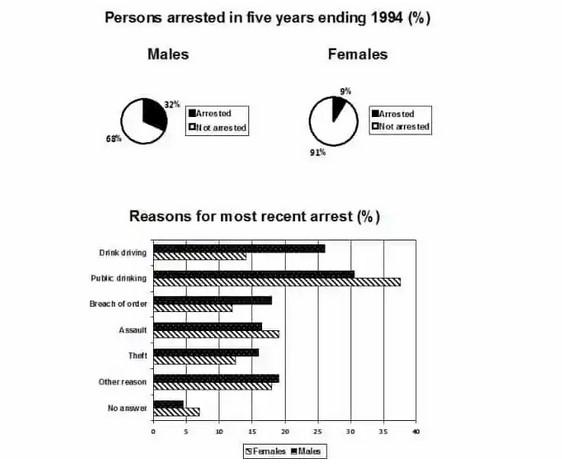
The above pie chart shows the percentage of people arrested in five years ending 1994 and the bar chart shows the most recent reasons for arrests.
Firstly
, in the pie table, there are two pie charts which describe males and females. In the male there was 32% arrested Linking Words
as well as
68% were not arrested. In female, there was 9% arrested and 91% was haven't.
Linking Words
Secondly
, the bar table shows data about the reason for the most recent arrests in %. Men are less compare to women in they are public drinking around 30% women and men nearly 37%, assault there are women more than 15% and men are 3% less and no answer in girls are less than 5% and boys are nearly 7%.
Linking Words
Thirdly
, boys are more than girls to drink Linking Words
while
driving both have an 8% difference, Breach of order have a 7% difference, in theft and other reason there is around a 5% difference.
In conclusion, Linking Words
thus
, the about data show information about girls and boys for arresting reasons.Linking Words