
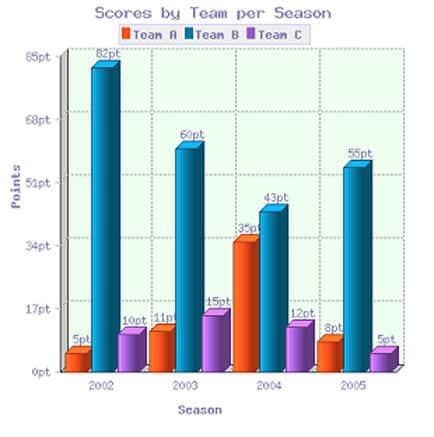
The bar chart represents data about
achievement
of three Add an article
the achievement
teams
A Use synonyms
B
Use synonyms
C
in different periods of time from 2002 to 2006. Looking from an Use synonyms
overall
perspective, there Linking Words
are
only one Change the verb form
is
team
which during all these years got the highest number of points it is Use synonyms
Team
Use synonyms
B
. Use synonyms
However
, other groups did not show Linking Words
the
stable results.
In 2002, Correct article usage
apply
team
A represented the lowest point ever (5 Use synonyms
pt
). Use synonyms
Team
Use synonyms
B
demonstrated the highest point (82 Use synonyms
pt
). Use synonyms
Team
Use synonyms
C
riches to 10 Use synonyms
pt
. In the next year Use synonyms
2003
the proportion of two Add a comma
,2003
teams
increased. Use synonyms
Team
A grew on 6pt and Use synonyms
teams
Use synonyms
C
rose on 5pt. Use synonyms
In contrast
, Linking Words
Team
Use synonyms
B
decreased on 22pt.
In 2004 the situation changed. The Number of points Use synonyms
Team
A soared significantly and riched 35pt. Use synonyms
Whereas
, Linking Words
teams
Use synonyms
B
and Use synonyms
C
continued to decline. In the following Use synonyms
years
the proportion of Add a comma
,years
Team
A dipped considerably. Use synonyms
Team
Use synonyms
C
decreased gradually. Use synonyms
While
Linking Words
team
Use synonyms
B
went up and riched 55pt.Use synonyms