The graph shows the transport modes in European city between 1960 and 2000

The graph shows the transport modes in European city between 1960 and 2000
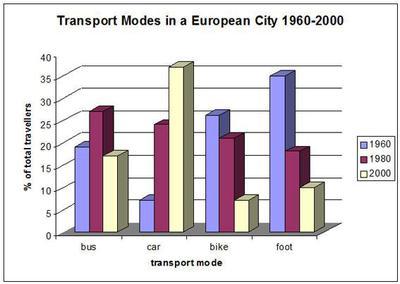
The given bar graph illustrates the several types of transport systems used by Europeans to travel from one city to another between 1960 to 2000. The legend is given in three different colours namely purple, wine and yellow colour.
Moreover
, the diagram is divided into four categories
such
as bus, car, bike and foot.
Overall
,
Submitted by simran31788 on

Unauthorized use and/or duplication of this material without express and written permission from this site’s author and/or owner is strictly prohibited. Excerpts and links may be used, provided that full and clear credit is given to Writing9 with appropriate and specific direction to the original content.

Basic structure: Write more paragraphs.
Basic structure: Add more body paragraphs.
Common mistake: Your writing should be 150-250 words.
Basic structure: Write more paragraphs.
Vocabulary: Rephrase the word "undefined" in your introduction.
Vocabulary: Only 5 basic words for charts were used.
Vocabulary: The word "give" was used 2 times.
Vocabulary: Use several vocabularies to present the data in the second paragraph.
What to do next:
Look at other essays: