
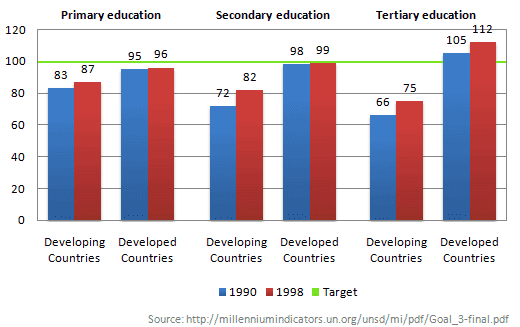
The given bar chart illustrates a comparison of the number of females per 100 male pupils in three different education levels both in developing and developed countries in 1990, 2000 and its target. From an
overall
perspective, it is evident that were significant differences in the data on females and males in types of countries where female students' number in developed nations was higher than the developing ones.
Linking Words
First,
in the elementary school in developing nations, there was a slight increase in female students number from 83 in 1990 to 87 in 1998, Linking Words
while
female pupils in the developed one rose slowly to somewhere in the vicinity of 96 in 1998. The destination, Linking Words
furthermore
, would be 100.
Linking Words
In addition
, in junior high school, the poor experienced considerable growth around 10 over Linking Words
this
period of time. The affluent one, meanwhile, was at almost 100. Linking Words
Whereas
, the target was always the same in three different education levels.
In senior high school, Linking Words
finally
, from a negligible 66 pupils in 1990, the figure for female students in poor nations saw a rapid climb to approximately 75 in 1998. In the developed one, Linking Words
in contrast
, it increased significantly more than its destination around 105 and 112 in 1990 and 1998, correspondingly.Linking Words