
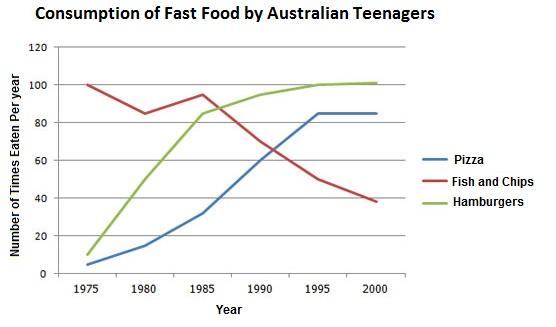
The line graph given illustrates the consumption of three kinds of fast food, including
pizza
, Use synonyms
fish
and Use synonyms
chips
and Use synonyms
hamburgers
by Australian youngsters throughout the period from 1975 to 2000.
Use synonyms
Overall
, as can be seen, Linking Words
pizza
and Use synonyms
hamburgers
experienced an increase, Use synonyms
while
Linking Words
fish
and Use synonyms
chips
consumption decreased over the given period.
In the beginning, Use synonyms
fish
and Use synonyms
chips
were the most popular fast food among teenagers with approximately 100 Use synonyms
times
which was eaten by Use synonyms
this
group in a Linking Words
year
, Use synonyms
although
Linking Words
this
number fell to just over 39 Linking Words
times
in a Use synonyms
year
which reached the least popularity Use synonyms
at the end
of the period.
Linking Words
In contrast
, Linking Words
pizza
and Use synonyms
hamburgers
consumption was the least popular fast foods compared to Use synonyms
fish
and Use synonyms
chips
which were eaten almost two Use synonyms
times
per Use synonyms
year
, Use synonyms
although
Linking Words
this
number had witnessed a rise to 100 Linking Words
times
per Use synonyms
year
for Use synonyms
hamburgers
and 82 Use synonyms
times
for Use synonyms
pizza
, Use synonyms
additionally
, Linking Words
hamburgers
reached the highest popularity compared to others in 2000.Use synonyms