
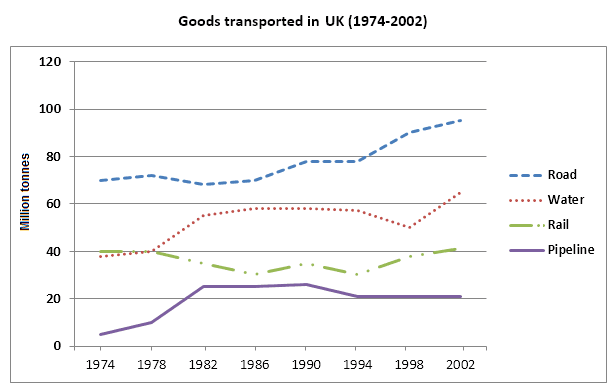
The graph below represents information about how many products were transported by different types of transport in the UK from 1974 to 2002.
Looking from an
overall
perspective, it could be seen that the biggest amount of goods Linking Words
were
transported using roads from 1974 to 2002.
At the begging of the times shown in the graph, the Change the verb form
was
proportion
of the ways which were used for transporting increased apart of rail. Use synonyms
However
, in 1978 the Linking Words
proportion
of Use synonyms
road
started to decrease , Fix the agreement mistake
roads
while
all Linking Words
other
continued to grow. Fix the agreement mistake
others
In the
1982 Change preposition
The
road
began Fix the agreement mistake
roads
rise
and riched 80 Add the particle
to rise
million
Use synonyms
tones
in 1994. In the same period , in 1982 water went up rich approximately 60 Correct your spelling
tonnes
million
times and stayed stable by 1994. Use synonyms
Use synonyms
Proportion
of rail from 1982 to 1994 fluctuated from 25 Add an article
The proportion
million
to 35 Use synonyms
million
. What about Use synonyms
numbers
pipeline is that they Correct article usage
the numbers
also
stayed stable from 1982 to 1994.
Linking Words
At the end
of Linking Words
period
in the graph, Add an article
the period
a period
Use synonyms
proportion
of all ways which were used for transporting goods climb and in Add an article
the proportion
the
2002 all these four ways riched the highest point. Road nearly 100 Change the article
apply
million
, Water over 60 Use synonyms
million
, Rail around 40 Use synonyms
million
, Pipeline more than 20 Use synonyms
million
.Use synonyms