
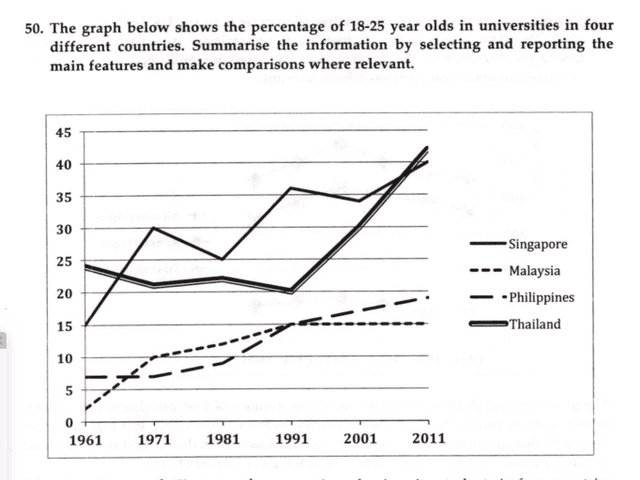
The supplied line graph provides information regarding 18-25 years old
students
(illustrated by Use synonyms
percentage
)in different countries. Use synonyms
Overall
, Linking Words
it is clear that
Thailand's Linking Words
students
led the way in the covered period by the graph.
It is lucid that the number of Thai and Singaporean graduates stood at 15 and 25 per cent, respectively. In the following years, Use synonyms
although
the ratio of Thai Linking Words
students
decreased gradually ( around 22%), Singaporean Use synonyms
students
increased sharply and reached 30% in 1971. From 1971 to 2011, the Use synonyms
percentage
of Singaporean Use synonyms
students
experienced considerable fluctuations and reached 40% by the end of the period. Use synonyms
However
, Thai Linking Words
students
after 1991 their Use synonyms
percentage
increased sharply and reached an all-time high of above 40% by 2001.
Regarding Malaysian and Philippine Use synonyms
students
, Use synonyms
although
the Linking Words
percentage
of Malaysian Use synonyms
students
stood at around 3% by 1961, Use synonyms
it is clear that
Linking Words
this
bonus increased steadily and reached below 20 per cent by 2011. Linking Words
On the other hand
, the Linking Words
percentage
of Use synonyms
Philippian's
Change noun form
Philippian
students
remained stable from 1991 to 2011 at 15 per cent.Use synonyms