
The given line graph shed
the
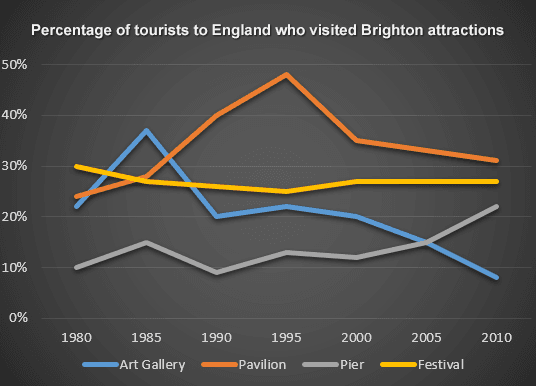
light on the frequency of arrivals at Brighton attractions in England from 1980 to 2010 with intervals of five years in each.
Correct article usage
apply
Overall
, it is crystal clear that tourism at Pavilion and Pier, Linking Words
whereas
it declined in terms of Art Galleries and Festivals, over time.
Linking Words
To begin
, in the initial year, 10% of people travelled to Pier. It remained almost the same after a decade with in-between fluctuations. Linking Words
However
, it ras rocketed for the next 20 years with minor differences and reached approximately 21%. Linking Words
Furthermore
, the percentage of individuals who went to the Art Gallery was 20% in 1980. Meantime, it was promoted to around 38% after 5 years, whilst it kept decreasing till the Linking Words
last
era and pointed at near about 10%.
Rolling towards the rest of the information, the number commencing from 30% for Festival, it was slightly plunged till 2010 and accounted at approx 28%. Linking Words
Moreover
, nearly 24% of the folks arrived at Pavilion in the forming year. The proportion gradually increased till 1995 and Linking Words
then
, it plummeted to 30% in the final.Linking Words