
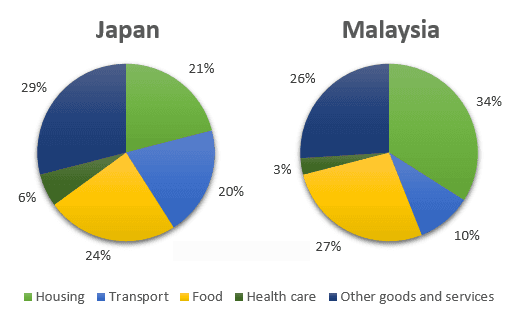
As an introduction, The pie charts illustrate the percentage of expenses on various household needs in two Asian countries, during the year 2010.
60% was allocated on the same in 26% and 34%.
Overall
, it can be seen that the most expenditure in both countries was on food, housing and other goods and services, Linking Words
while
the least was on healthcare.
Linking Words
To begin
with, in Japan, half of all money was spent on other goods and services and on transport at 29% and 21% respectively. Linking Words
However
, in MalaysiaLinking Words
Add a comma
,
Furthermore
, the almost equal percentage was distributed for food and healthcare in both countries, which was around 25% and less than 10% respectively.
Linking Words
In contrast
, Linking Words
although
Japan contributed 20% of the income to transport, half of that was allocated for the same purpose in Malaysia.Linking Words