
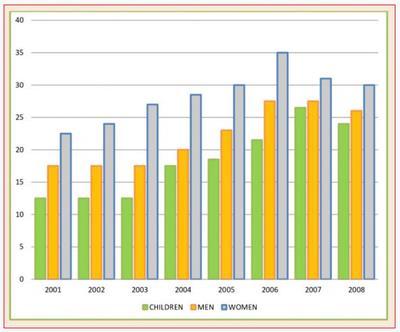
The supplied column graph compares the consumption of fruits and vegetables among
children
, Use synonyms
men
, and Use synonyms
women
in the united kingdom based on the percentages from 2001 to 2008. Generally, Use synonyms
it is clear that
the rate of consuming fruits and vegetables increased moderately among Linking Words
children
and Use synonyms
men
in the covered period.
At the beginning of the period, the rates of consumption in Use synonyms
children
, Use synonyms
men
, and Use synonyms
women
stood approximately at 12, 18, and 23 per cent, respectively. These numbers increased constantly until 2006 when Use synonyms
women
led the way in comparison with Use synonyms
children
and Use synonyms
men
and reached 35% in eating fruits and vegetables.
From 2006 to 2008, Use synonyms
although
the consumption of healthy foods in Linking Words
women
dropped slightly and reached 25% in comparison with 2006, which was 35%, Use synonyms
women
still kept leading in healthy foods among Use synonyms
children
and Use synonyms
men
, which was around 24 and 27 per cent, respectively by the final year of the period (2008).Use synonyms