You should spend about 20 minutes on this task. The pie chart shows the amount of money that a children's charity located in the USA spent and received in one year, 2016. Summarise the information by selecting and reporting the main features and make comparisons where relevant.

You should spend about 20 minutes on this task.

The pie chart shows the amount of money that a children's charity located in the USA spent and received in one year, 2016.

Summarise the information by selecting and reporting the main features and make comparisons where relevant.
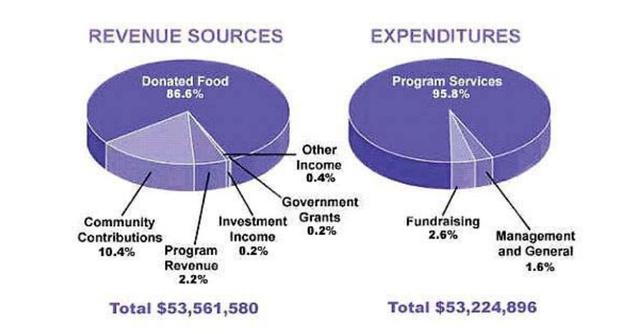
These pie charts illustrated how much money was used and received for children's charities in the USA in 2016.
Overall
, donated food accounted for a large part of the category of revenue sources,
while
the proportion of program services was larger than any others in the sector of expenditures. Focusing on revenue sources, the percentage of donated food had 86.6%,
this
was the largest of
this
sector.
Although
community contributions were the second largest at 10.4%, other categories were less than 1% except for program revenue at 2.2%. Investment income and government grants were the same percentages at 0.2%. Turning to expenditures, program services made up the largest part of
this
pie chart at 95.8%. There are two categories, fundraising and Management and general, with 2.6% and 1.6%, respectively.
Submitted by songcheng619 on

Unauthorized use and/or duplication of this material without express and written permission from this site’s author and/or owner is strictly prohibited. Excerpts and links may be used, provided that full and clear credit is given to Writing9 with appropriate and specific direction to the original content.

Common mistake: Your writing should be 150-250 words.
Vocabulary: Only 4 basic words for charts were used.
Vocabulary: The word "charts" was used 2 times.
Vocabulary: The word "percentage" was used 2 times.
What to do next:
Look at other essays: