
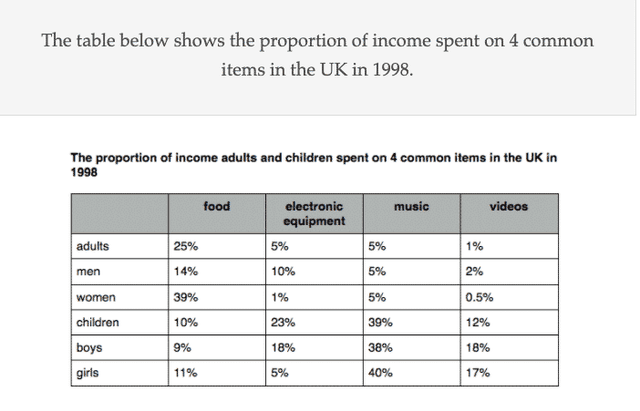
The given table compares the percentage of
income
spent on food, electronic devices, music and Use synonyms
videos
by Use synonyms
adults
and children in 1998.
Use synonyms
Overall
, Linking Words
while
Linking Words
adults
spent most of their Use synonyms
income
on food, children preferred music. Use synonyms
Videos
were one of the least spent on items for Use synonyms
adults
.
A deep analysis of the bar chart provided reveals Use synonyms
adults
’ Use synonyms
income
, about 23% of their Use synonyms
income
was spent on food, with women accounting for most of Use synonyms
this
at 39% and men only 14%. Linking Words
In contrast
, electronic equipment was purchased more by men than women , with 10% and 1% respectively. Linking Words
Videos
were the least popular category among Use synonyms
adults
with only 1% of the money earned spent on it.
From the statistics, it can be inferred that children utilized a major proportion of their money on music with boys and girls spending almost the same. Use synonyms
Similarly
, Linking Words
although
Linking Words
videos
were not the most popular item on the list both boys and girls spent almost the same on them with 18% and 17% respectively. Meanwhile, the item with the biggest disparity among the young was electronic equipment, with boys spending 18% of their expenses on it compared to girls who only spent 5%.Use synonyms