The graph below shows the percentage of mobile phone owners using various mobile phone features in Vietnam in the year 2005, 2008, 2010.

The graph below shows the percentage of mobile phone owners using various mobile phone features in Vietnam in the year 2005, 2008, 2010.
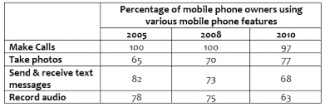
The table gives information about the percentage of mobile phone owners using various mobile phone features in Vietnam in the years 2005, 2008, and 2010.
Overall
, the percentage of making calls, sending & receiving text messages, and recording audio from 2005 to 2010 are decrease a little. At that time, taking photos increased. It can be seen from the table in the years 2005 and 2008, make calls no change (100%), to 2010 it fall to 97%. Send & receive text messages reduce from 82% to 68%. The percentage of recorded audio in 2005, 2008, and 2010 is the most decreased is 15% (from 78% to 63%). From the statistics, it can be seen that taking photos, increases year by year, from 2005 to 2008 by 5% (65% to 70%) , and from 2005 to 2010 by 7% (70% to 77%).
Submitted by yeshomeclass on

Unauthorized use and/or duplication of this material without express and written permission from this site’s author and/or owner is strictly prohibited. Excerpts and links may be used, provided that full and clear credit is given to Writing9 with appropriate and specific direction to the original content.

Linking words: Add more linking words.
Common mistake: Your writing should be 150-250 words.
Vocabulary: Rephrase your introduction. Words match: 71%.
Vocabulary: The word "table" was used 2 times.
Vocabulary: The word "percentage" was used 3 times.
Vocabulary: The word "decrease" was used 2 times.
Vocabulary: The word "increased" was used 2 times.
What to do next:
Look at other essays: