
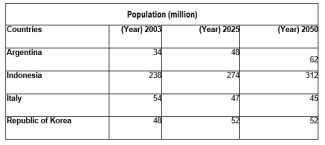
The table provides information about the
population
figures for four countries for 2003 and projected for 2025 and 2050.
Use synonyms
Overall
, Linking Words
it is clear that
the rate of Linking Words
population
in Indonesia is highest during three years and in 2025 it will be highest at about 312 than in 2003 and 2025.
Looking at the table for more detail, in 2003, the Use synonyms
population
of fingers was lowest in Argentina about 34. Use synonyms
Then
, it will slightly increase to 48 in 2025 and to 62 in 2050. What is more, in Italy , it slowly drops from 54 to 45 during these three years.
Linking Words
Moreover
, the average Linking Words
population
in the Republic of Korea was 48 in 2003 and will steadily go up to 52. After that , it will not change in 2025 and 2050.Use synonyms