
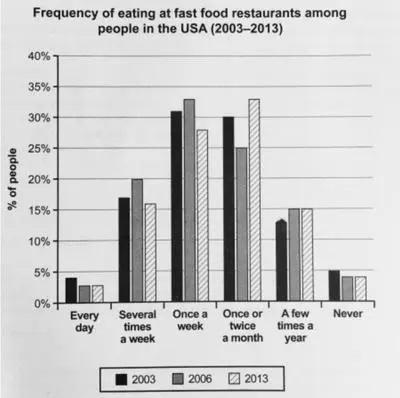
The illustration gives information about the frequency of eating fast
food
in US restaurants between 2003 and 2013. Use synonyms
Overall
,the Linking Words
percentage
of Use synonyms
people
who ate fast Use synonyms
food
in daily life had low value to those who ate once or twice a month.
It is quite evident from the bar chart that the Use synonyms
percentage
of Use synonyms
people
who ate daily basis fast Use synonyms
food
at restaurants had a minimum value in 2013 but in 2006 the Use synonyms
percentage
of Use synonyms
people
that ate fast Use synonyms
food
several times a week had increased. Use synonyms
In contrast
, the Linking Words
percentage
of Use synonyms
people
who ate fast Use synonyms
food
once a week apply increased gradually in 2013.
Use synonyms
Furthermore
,the Linking Words
percentage
of Use synonyms
people
who ate fast Use synonyms
food
once or twice a month apply increased in 2013. But the Use synonyms
percentage
of Use synonyms
people
who ate fast Use synonyms
food
a few times a year apply decreased in 2014. , the Use synonyms
percentage
of Use synonyms
people
who ate fast Use synonyms
food
never Use synonyms
had
increased in 2003Unnecessary verb
apply